Interactive Floodplain Development Data
This website serves as a companion page to the paper “A nationwide analysis of community-level floodplain development outcomes and key influences” (Agopian et al. 2024).
Introduction
The development of land in floodplains increases flood risk by increasing the exposure of people and critical infrastructure to flood hazards. Limiting floodplain development through legal and regulatory land use management tools is therefore a key strategy in limiting flood damages. Studies that have measured floodplain development have been historically constrained to small geographic extents, limiting insights into effective floodplain management across contexts and scales. Here, we develop two nationwide indexes measuring floodplain development across the continental United States. These indexes enable systematic investigation of floodplain development trends across communities and assessment of the effectiveness of municipal approaches to floodplain management.
Floodplain Development Index (FDI) and Floodplain Housing Index (FHI)
The FDI is calculated as the ratio of the share of new development in the floodplain to the share of developable land in the floodplain for each community:
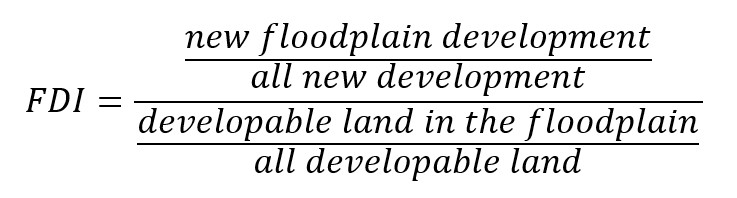
New development is defined as a ≥10% change in impervious surface, measured at a 30 x 30 m spatial resolution. Floodplain extent is determined using digitized regulatory floodplain maps for each state.
The FHI only considers new residential development in the floodplain:
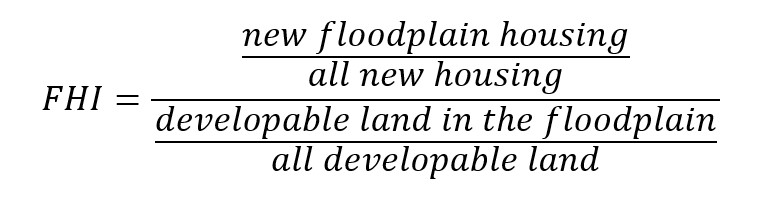
New housing is defined based on property data from the Zillow Transaction and Assessment dataset (ZTRAX).
For both indexes, the share development in the floodplain is compared to the share of land in the floodplain to account for the differing extent of flood hazard across communities. Communities that face higher levels of flood hazard should be expected to have higher levels of floodplain development in raw numbers, and vice-versa. By constructing these indexes as ratios, we are able to assess which communities have developed in their floodplains more (FDI/FHI > 1) or less (FDI/FHI < 1) than would be expected given the flood hazard they face.
Key Findings
- Nationwide, 2.1 million acres of floodplain land were developed, and 844,000 residential properties were built in the floodplain
- In Florida alone, 398,000 new homes were built in the floodplain (47% of the nationwide total)
- However, most states and communities have actually limited new floodplain development and housing relative to the flood hazard they face
- 74% of communities have a lower share of new development in the floodplain than developable land in the floodplain (FDI < 1)
- 87% of communities have a lower share of new housing in the floodplain than developable land in the floodplain (FHI < 1)
- In Florida, for example, just 21% of all new housing was built in the floodplain despite 40% of Florida’s land being floodplain (just over half the amount that would be expected)
Interactive Data Explorer
The nationwide map below displays our data. Clicking on a community will open a pop-up tab with the relevant data. The search bar can be used to locate a community of interest.
Note: Communities in gray (marked as “NA”) are those that lack digitized flood insurance rate maps. Data for these communities are marked as -999—this is a missing data code, and does not reflect actual values for these communities.
For full results, including tabular data, visit our Data Repository.

